Project dashboard: what to include, and what to avoid
A good dashboard can be read in ten seconds; a bad one gets looked at once, then never again. The difference comes down to the questions it answers.
A good dashboard can be read in ten seconds. A bad one gets looked at once, on the day it was built, then never again. The difference has nothing to do with the number of charts or how pretty they are, and everything to do with the questions it answers. Here's how to put together a project dashboard you'll actually open every day.
What a dashboard is really for
A project dashboard should answer three questions, in this order:
- What do I do now?
- What's stuck?
- Are we making progress?
Anything that answers none of these three questions is decoration. It may be nice to look at, but it takes up space and spreads your attention thin.
Start with the questions, not the widgets
The natural reflex is to add every available widget and see what happens. Do the opposite: first write down three to five questions you genuinely ask yourself when you open your tool in the morning. For example:
- What's due today?
- What's overdue?
- Who's swamped in the team?
- What have I been asked to read?
- Where is each project at?
Only then should you choose one widget per question.
The essentials, for almost everyone
Four widgets cover most needs:
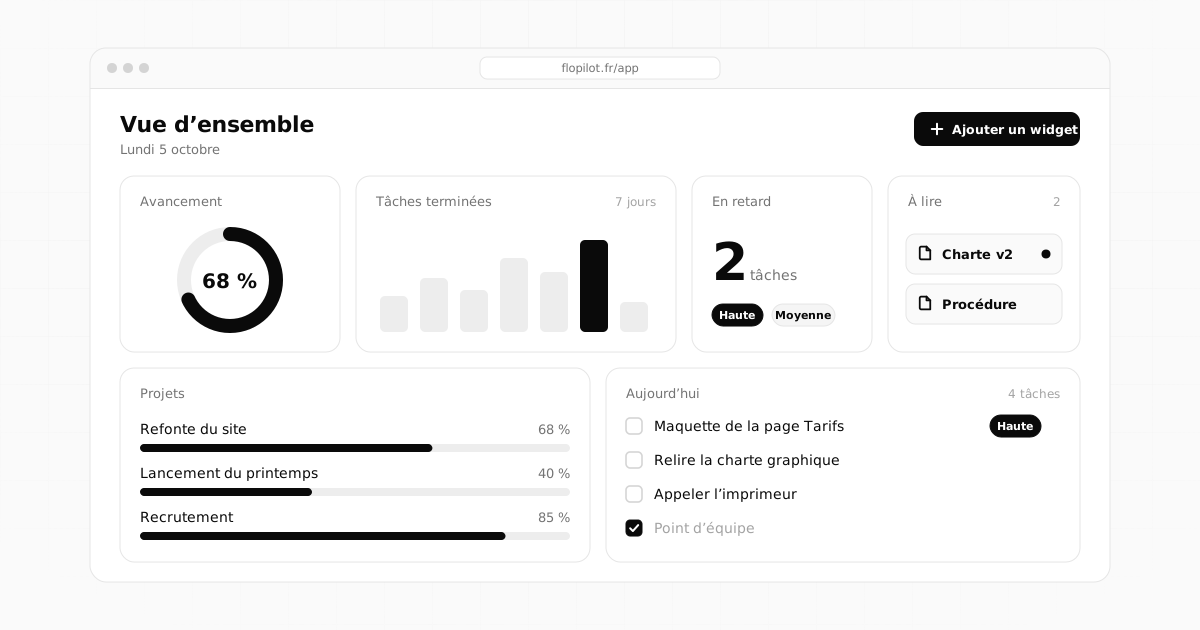
- Today: the day's tasks, overdue ones and the day's events. This is the answer to "what do I do now".
- Overdue: everything that has passed its due date. If this widget is empty, all is well; if it starts filling up, that's your first warning sign.
- This week: the next seven days at a glance, so you can plan ahead.
- Progress: how each project, or each stage of a project, is coming along.
For a team
As soon as there are several of you, other questions come up:
- Team workload: the number of open tasks per person. Useful for spotting who's swamped before it becomes a problem.
- Priorities: high and urgent tasks, across everyone.
- Recent activity: what the team has done lately, so you can keep up without asking.
- To read: the documents, notes and links you've been asked to read.
For keeping context close at hand
Some widgets don't measure anything, but they save you from hunting around:
- Useful links: the project's addresses, sorted by category.
- Memos: pinned memos and lists.
- Recent documents: the latest files added.
- Quick add: create a task in one sentence, without leaving the dashboard.
- Key figures: open tasks, tasks done this week, overdue tasks, number of documents.
| Widget | Question it answers |
|---|---|
| Today | What do I do now? |
| Overdue | What's stuck? |
| Progress | Are we making progress? |
| Team workload | Who's swamped? |
| To read | What do I need to read? |
| Useful links | Where's the mockup, the client area, the tool? |
One dashboard per project, and one for everything
There are two levels of reading, and they don't need the same widgets. In Flopilot, each project has its own dashboard, and the Overview has one for the whole organisation.
- A project dashboard shows progress by stage, that project's overdue tasks, its useful links and its recent documents.
- The Overview dashboard shows your day across all projects, each project's progress and the team's workload.
Widgets can be chosen, moved and resized: everyone builds their own.
Add figures from your other tools
A dashboard becomes truly central when it also brings together what's happening elsewhere. Flopilot connects to the apps in the Flopix family: you can follow your Flopix website's visits or approve your Flopost carousels straight from your dashboard, right next to your tasks.
What's best avoided
- Too many widgets: beyond six to eight, the eye no longer knows where to look. If you have to scroll, it's too much.
- Figures that lead to no action: the total number of tasks created since the start won't help you decide anything.
- Flattering figures: a counter that only ever goes up is reassuring, but it doesn't tell you whether the project is on schedule.
- A dashboard nobody looks at: tie it to a ritual (the Monday meeting, the Friday review), otherwise it'll soon be forgotten.
Three layouts that work
Keep your dashboard evolving
A dashboard is never set in stone. Once a month, ask yourself a simple question: which widget haven't I looked at even once? Remove it. And if you catch yourself often hunting for the same piece of information, a widget is missing.
Frequently asked questions
Which metrics should you track on a project dashboard?
The most useful ones are those that lead to an action: today's tasks, overdue tasks, progress by stage and, in a team, each person's workload. Counters that don't help you decide anything can go.
How many widgets should a dashboard have?
Between four and eight. Beyond that, you have to scroll and the eye no longer knows where to look. One dashboard per project is better than a single overloaded one.
Can each project have its own dashboard?
Yes. In Flopilot, each project has its own dashboard, and the Overview has one for the whole organisation. Widgets can be freely chosen, moved and resized.
Organise your projects with Flopilot
Tasks, notes, readable documents, To read and dashboards, all in one place. No commitment, and your guests never pay.
DashboardProject managementMetrics